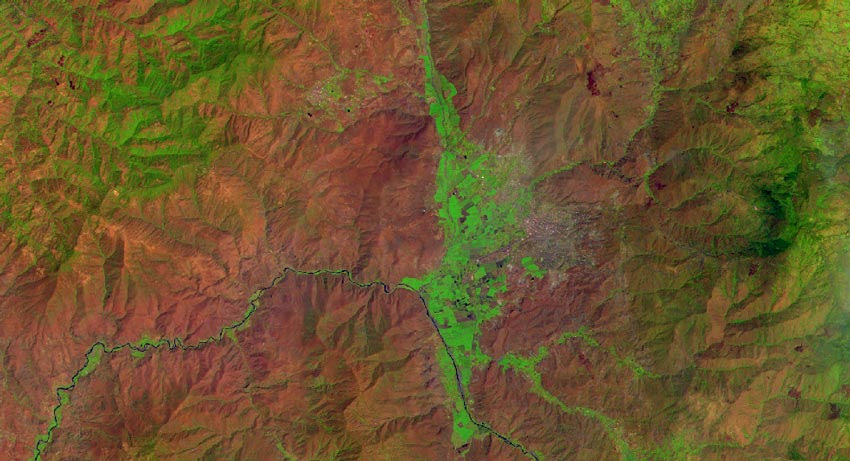
Satellite technology gives detailed information about the state of the soil and crops. It enables farmers to optimize agricultural processes to achieve the best result and minimize environmental damage. Agricultural software transmitting data uses satellite bands and indices like NDMI and NDVI. Let’s take a closer look at the features of this technology.
Satellite Bands and Indices
Satellite remote sensors capture light in the form of waves that are invisible to the naked eye. Each wave range corresponds to a specific spectral band, reflecting information about different indicators. In particular, the coastal strip displays shallow waters, ocean color changes, and aerosol particles in the atmosphere. Blue, green, and red bands are used to visualize information. Their range is from 400 to 700 nanometers. Together, these colors form a panchromatic band (Pan). It is a black and white image that provides a higher resolution than other bands. Therefore, the combination of the Pan band with other spectral bands gives the best results.
Near-infrared (NIR) wavelengths are used for plant monitoring. They are also suitable for visualizing water bodies against the background of surrounding objects. The software uses long infrared (LWIR) wavelengths of 8-14 microns to measure land and water temperatures.
Vegetation Indices
Agricultural software allows farmers to analyze crop changes remotely using vegetation indices. They are indicators calculated based on the spectral ranges of remote sensing data. Among the advantages of software using vegetation indexes:
- highly accurate information;
- analysis of the state of plants according to various indicators;
- reduction of internal expenses;
- improvement of product quality.
Today, specialized applications include several vegetation indexes. For example, the EOS Crop Monitoring platform consists of the following:
- NDVI can be used throughout the season; that’s why it is the most common index;
- ReCI demonstrates the photosynthetic activity of the crown based on the amount of chlorophyll in the leaves;
- NDRE is used to monitor mature crops;
- MSAVI allows you to analyze the crop without affecting the soil conditions on the results in areas with sparse vegetation.
If necessary, farmers can add additional indicators to the application not included in the software by default. Thus, growers have the opportunity to expand their set of analytical tools constantly.
Band Combinations in Details
To navigate the indications of satellite bands, you need to understand what each color means. Let’s take a closer look at the possible combinations.
Natural Color
Since we only navigate in the visible range, satellite bands display information in a combination of red, green, and blue bands. So the application imitates the visible spectrum, the so-called natural color. However, these images are often low-contrast, making it difficult to detail the data. Therefore, depending on the purpose of the study, different proportions of colors are used.
The combination 3-2-1 (red, green, and blue, respectively) is suitable for monitoring water bodies’ condition and depth. In this case, the coastline is displayed in white, healthy vegetation in green, diseased plants in brown-yellow, roads in gray, and harvested fields in a light tint.
Color Infrared
This combination of colors displays the vegetation in red. Such images look somewhat unnatural because green plants easily reflect infrared light energy. At the same time, this combination makes it easy to detect them. At the same time, broad-leaved trees look lighter than conifers. It is because spectral reflectivity depends on the absorption level of water and chlorophyll. Soils in this combination are displayed in shades of brown, urban areas in blue or yellow and white.
Thermal
This combination is used to monitor the earth’s temperature and determine the landscape’s agricultural potential. The strip is suitable for operation in conditions such as fog and smoke. Farmers can use it to analyze soil moisture levels and vegetation stress. It helps to measure the amount of water needed to irrigate the crop. Shades of gray represent the color scheme. Cold objects appear black and hot things appear white. Color images are used to identify objects with different temperatures. Also, unlike the visual one, the thermal spectrum is suitable for displaying transparent effects like glass and water.
Chlorophyll Index
This index shows the amount of chlorophyll in plants. There are two types – Clgreen and Clred-edge. The latter displays the red-to-near-infrared conversion as a narrow band. In this case, the higher the reflection, the greener the area. This index is critical in assessing crop health. Photosynthesis products account for up to 95 percent of the plant’s dry mass. The control of the plants’ photosynthetic activity allows timely detection of diseases and other causes of their death. High chlorophyll crops are indicated in green, harvested and plowed fields in orange and red, meadows, and areas with sprouts yellow and pale green growth.
Thus, in combination with vegetation indices, satellite bands allow farmers to monitor the current state and development dynamics of the field and cultivated plants. At the same time, visual information is presented in a convenient form and is available wherever the grower is.


